Collection Details
- Once the scan begins, the scan engine will run the selected test cases on each endpoint.
- The endpoints are selected based on their authentication status (authenticated or unauthenticated) and the HTTP methods used (GET, POST, PUT, and DELETE).
- You can monitor the scan progress directly from the terminal.
- The time to complete the scan depends on several factors, such as machine capacity (e.g., RAM and processor), so the scan might take some time.
Viewing Your Results
Viewing scan results can help you understand your organization’s security posture and vulnerabilities. Color-coded indicators allow you to tailor how you view your scan’s data.
You can view scan results in one of several views:
Collection details
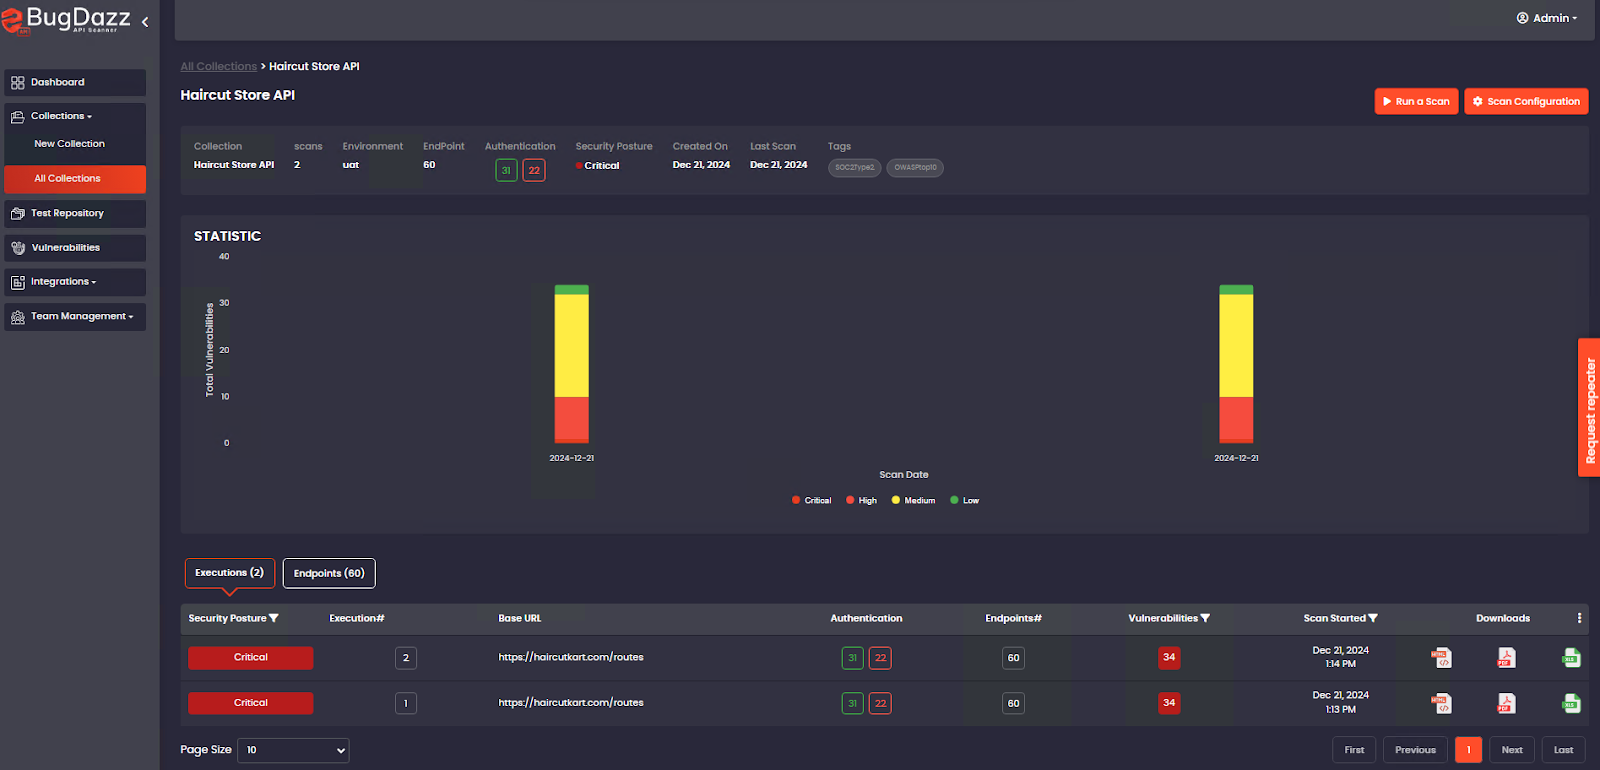
The Collection Details Page provides an overview of the vulnerabilities identified during the scans of a selected API collection. It displays key information about the collection, scan status, and analysis results. Below is a detailed explanation of each element on this page:
Buttons: 'Run a Scan' and 'Scan Configuration'
Run a Scan:
Initiates a new vulnerability scan for the API collection. When clicked, it starts the scan process and updates the results in the Execution tab once completed.
Scan Configuration:
Allows users to configure scan settings such as authentication methods, scan scope, or specific endpoints to include/exclude. Opens a configuration page to customize scan parameters.
Header Strip
The header strip displays the metadata and high-level details of the API collection being analyzed. The key elements are:
- Collection Name: Displays the name of the API collection (e.g., "Haircut Store API").
- Scans: Shows the total number of scans executed for this collection (e.g., "2").
- Environment: Indicates the environment where the scan is performed (e.g., "UAT").
- Endpoints: Total number of endpoints in the collection (e.g., "60").
- Authentication: Number of endpoints Authenticated or Unauthenticated :
- Green Box: Authenticated endpoints (e.g., "31").
- Red Box: Unauthenticated endpoints (e.g., "22").
- Security Posture: Overall security level of the collection, based on vulnerability severity:
- Critical: Indicates significant vulnerabilities requiring immediate attention.
- Created On and Last Scan: Timestamps for when the collection was created and last scanned.
- Tags: Displays associated tags for classification or compliance (e.g., SOC2Type2, OWASPtop10).
Graph: Vulnerability Statistics
Provides a graphical representation of vulnerabilities discovered during scans.
- Vertical Axis: Represents the total count of vulnerabilities.
- Horizontal Axis: Represents scan dates.
- Color-coded Bars:
- Amber: Critical-severity vulnerabilities.
- Red: High-severity vulnerabilities.
- Yellow: Medium -severity vulnerabilities.
- Green: Low-severity vulnerabilities.
- Insights: Helps track vulnerability trends over multiple scans. For example, a bar dated "2024-12-21" shows the distribution of vulnerabilities discovered on that date.
The Execution Tab lists the details of past scan executions. Each row represents a single scan instance and The Endpoints Tab provides a breakdown of all the endpoints scanned in the API collection
Execution Tab
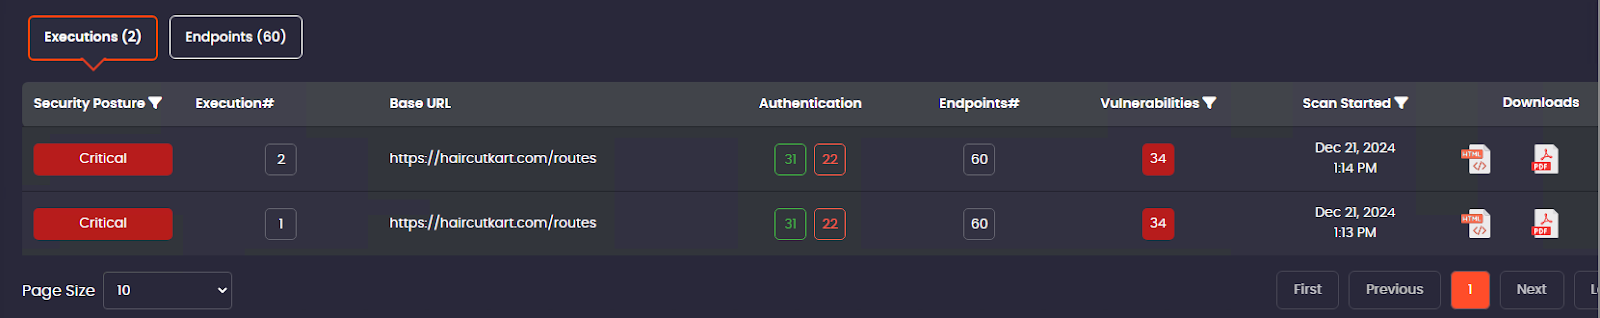
The Execution Tab lists the details of past scan executions. Each row represents a single scan instance. The columns include:
- Security Posture: The overall security level of the scan (e.g., "Critical").
- Execution#: A unique identifier for the scan execution.
- Base URL: The URL of the API being scanned (e.g., "https://haircutkart.com/routes").
- Authentication: Displays the number of endpoints that are secure (green) and unsecure (red).
- Endpoints#: Total number of endpoints scanned.
- Vulnerabilities: The number of vulnerabilities detected (e.g., "34").
- Scan Started: Timestamp indicating when the scan began (e.g., "Dec 21, 2024, 1:14 PM").
- Downloads: Allows users to download scan results in different formats:
- HTML Report
- PDF Report
- CSV Data
Users can navigate through multiple pages of scan executions using pagination controls at the bottom.
Upon clicking on a row user shall navigate to execution details page.